
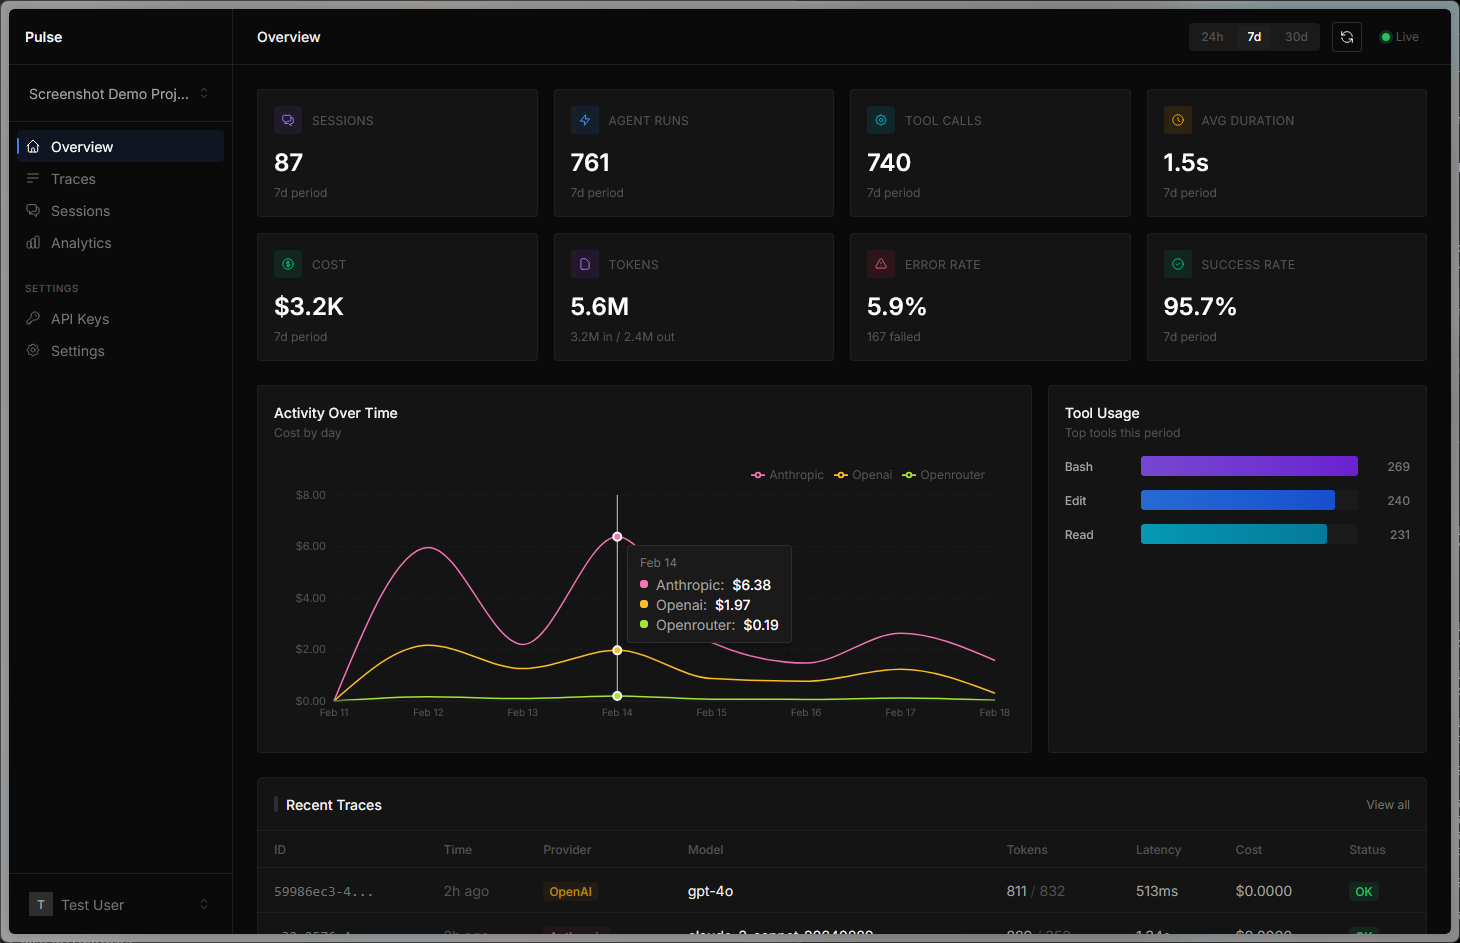
Command Center
Overview of traces, spend, and live service health across your projects.
Trace prompts, completions, latency, tokens, and cost across OpenAI, Anthropic, and OpenRouter with a single SDK for TypeScript and Python.
Run this script to install the Pulse server binary, then start instrumenting with the SDK.
curl -fsSL https://raw.githubusercontent.com/EK-LABS-LLC/trace-service/main/scripts/install.sh | bash -s -- pulseNative integrations for agent runtimes and CLIs so traces, runs, and tool activity land in one system.
Fast visibility for tracing, run replay, triage, and spend decisions.
Overview of traces, spend, and live service health across your projects.
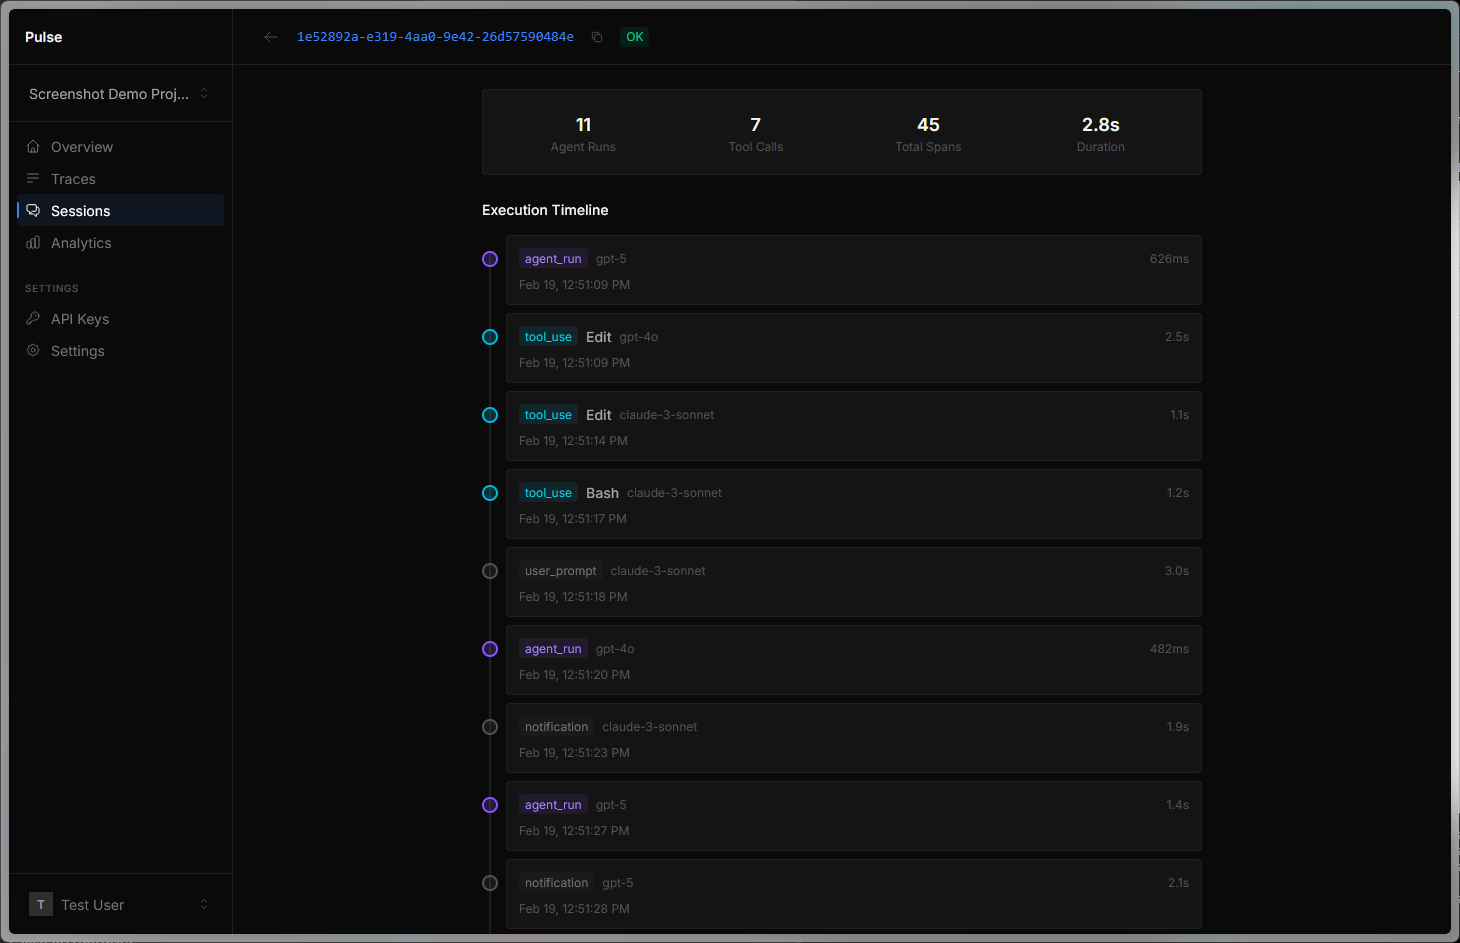
Replay each agent run with tool calls, timing, and failure points in order.
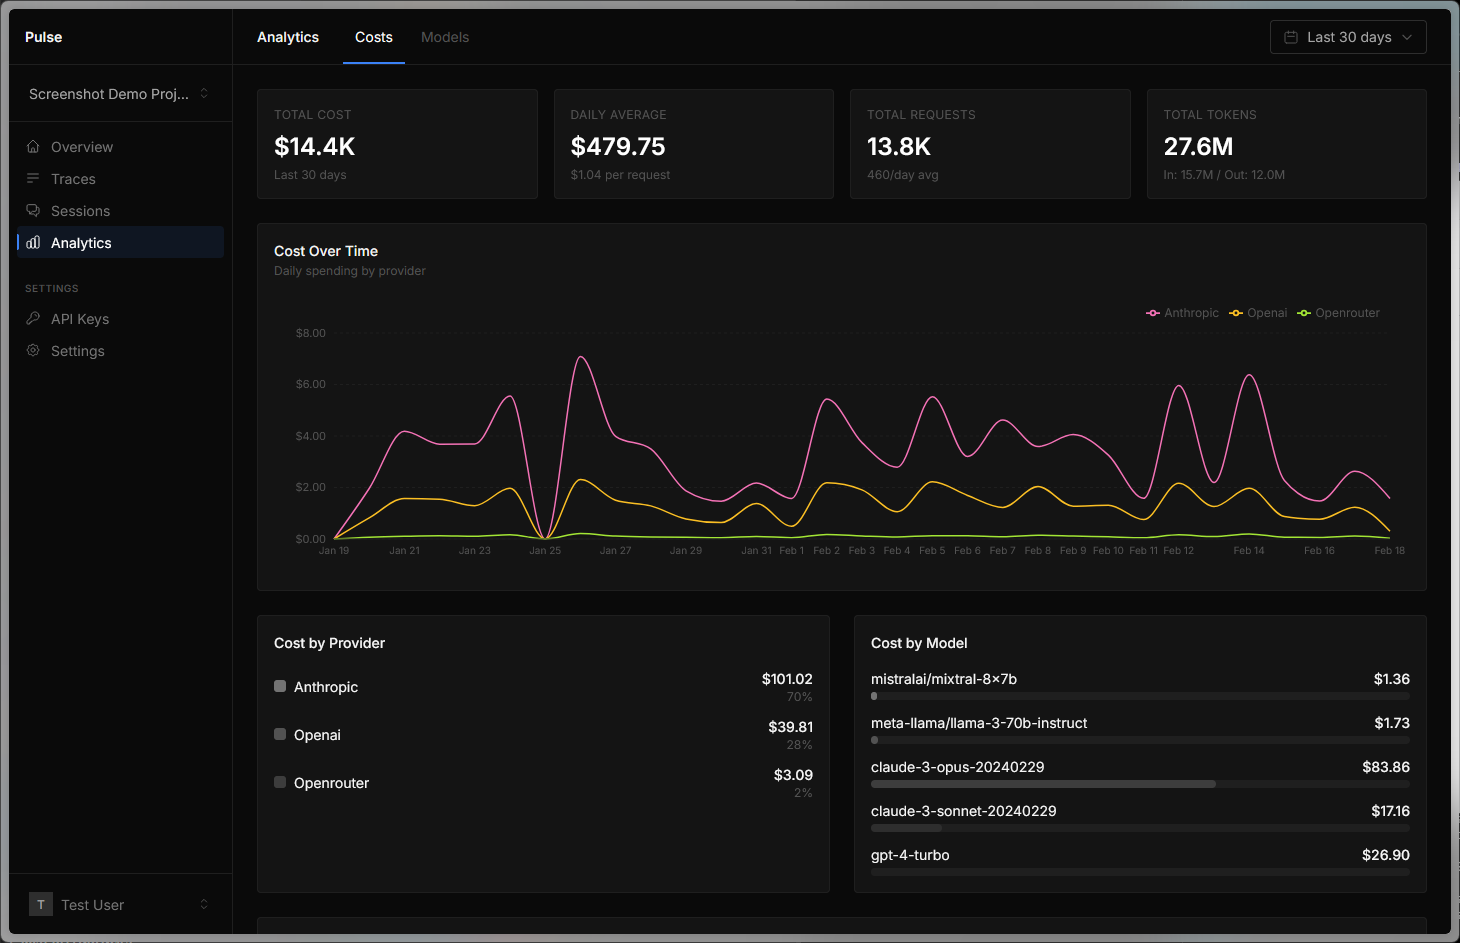
Track token usage and cost trends to catch spikes before they become problems.
From individual traces to full session timelines, Pulse gives your team the visibility to ship with confidence.
Every prompt, completion, token count, latency, and cost stored with full request and response bodies.
Group related calls into sessions. See full conversations or agent runs as a timeline.
Track spend per model, per project, per session. Catch cost spikes before they hit your bill.
OpenAI, Anthropic, OpenRouter. One SDK, consistent metrics across all providers.
Pivot from aggregate analytics to individual traces and spans quickly when incidents happen.
Run as a single binary with built-in SQLite, or switch to Postgres + partitioned listeners for higher throughput.
Three steps to full observability across your LLM stack.
Add the SDK to your project. Works with JS/TS and Python runtimes.
bun add @pulse/sdk
pip install pulse-sdkCall observe() on your existing client. No API rewrite.
const client = observe(
  new OpenAI({ apiKey: "sk-..." }),
  Provider.OpenAI
);Traces flow in automatically. Search, filter, and analyze quickly.
142 traces captured
$0.47 total cost
avg latency 1.2sGuides, API reference, and examples to get from zero to production.
Install the SDK, create an API key, and capture your first trace in under 5 minutes.
Read guide →Integrate with OpenAI, Anthropic, and OpenRouter using the observe() wrapper.
Read guide →Query traces, sessions, and analytics programmatically. Full endpoint documentation.
Read guide →Group traces with session IDs and attach custom metadata for filtering.
Read guide →Batching, flush intervals, disabling tracing, and all initPulse() options.
Read guide →Free and open source. Self-host anywhere.